
Development
Trading software that stays in control under load and after a restart
We program Expert Advisors (EAs) for MetaTrader 4 and MetaTrader 5 and develop custom trading software in Switzerland: EA programming on request, MT4 to MT5 conversion, copy systems, risk and monitoring functions.
For us, software is not finished when it works once. It is ready when its behaviour stays traceable under difficult and repeatable conditions.
What we build
Software for the daily reality of live trading
- Expert Advisors for MT4 and MT5. Concrete trading and risk rules, executed reproducibly. Signals are recognised unambiguously, state survives restarts, manual and automatic orders stay separate, and existing functions stay unchanged when new ones are added.
- Convert MT4 to MT5: rebuilding MT4 code for MT5. Not a plain conversion. On request the code is extended at the same time, for example with new error handling or with a news reader that can really be adapted to your rules instead of working to a standard. The code is brought up to the current state of the art.
- Copy systems in both directions. Transfer trades safely between MT4 and MT5, including changes to stop loss and take profit, partial closes, fast open-close sequences and terminal restarts. Also possible: copying and monitoring MT4 and MT5 directly via FIX API.
- Connecting several MetaTrader sources to one target platform. Identity checks, a durable journal, routing and risk rules, controlled execution, continuous position reconciliation, self-diagnosis and alerting via Telegram or WhatsApp.
- Correlation research across several symbols. Historical ideas are first reconstructed forensically and then broken into measurable questions: costs, data quality, stability across market phases and a later period that was left untouched.
Copy trading and trade copiers for MT4 and MT5
We build trade copiers that transfer trades between accounts, on the same server or over the internet, between MT4 and MT5 in both directions. Changes to stop loss and take profit, partial closes and terminal restarts are carried over. If you have a good trading product, we advise you on the technical side of running it through copy solutions directly at brokers, working with broker partners. This is technology and infrastructure: we do not manage third-party capital and we do not give investment advice.
Projects
Four examples from practice
Expert Advisor
Client project A
Complex MT4 trading logic with persistent signals, several entry modes, grid and risk functions and backward-compatible state handling.
Copy tool
Client project B
MT4 and MT5 in both directions, tested with multi-symbol bursts, modifications, partial closes, restarts and multi-hour soak tests.
Integration
Client project C
Several MetaTrader sources, central risk and routing logic, durable journal, reconciliation, self-diagnosis, safe recovery and Telegram alerting.
Research
Client project D
Forensic reconstruction and modern validation of multi-symbol correlations with historical data, original ticks, cost models and out-of-sample checks.
Testing your product
We test your finished or half-finished system in our test environment
You have built a product and want to know whether it keeps its promise? We test it in the environment we built for our own development: complete, repeatable and with a report you can pass on.
What we test
Expert Advisor
Trading and risk logic, signal detection, state across restarts, behaviour on broker rejections, lot and symbol rules.
Indicators
Calculation against an independent reference, behaviour on data gaps, repainting and later changes, suitability as a basis for decisions.
Connectors and copy systems
Transfer between the platforms, modifications, partial closes, burst load, connection drops and position reconciliation.
Observer and monitoring
Does the monitoring detect real deviations, report them reliably and tell a new incident from an all-clear?
How a test engagement runs
- 01
Handover and intake
You deliver the product as it stands, finished or half-finished, with your description of the intended behaviour. We record version, scope and test goals in writing.
- 02
Testing in our environment
Function, integration, load, restart and fault injection, using the same chain of checks as for our own products. Every run is logged with period, spread and product version.
- 03
Your own parameters, tailored
You can specify additional parameters, scenarios and market phases that we test specifically for you. Whatever matters most to you gets its own section in the report.
- 04
Optimisation on request
If you wish, we optimise the product and improve it as far as it can be shown. Development happens on a development period; the test period stays untouched. If no improvement shows, the report says so as well.
- 05
Full report
At the end you receive a detailed report with method, results, findings and recommendations. On request we add ready-to-use set files you can use directly in your software.
What you receive
- Full report Method, test scope, results, findings and recommendations, documented so they can be followed.
- Ready-to-use set files On request, tested configurations you can use directly in your software.
- Tailored evaluation Your additional parameters and scenarios, reported separately.
- Optimisation proposals Only where an improvement can be shown, stating the period on which it arose.
A test shows how a product behaves within the tested scope. It is not a promise of profit and no guarantee of future results.
Case study
SENTI_MC_V2ML200_FULL_v6 and SENTI_PORTFOLIO_V2ML200_v2
Two reports from our own development, with their figures unchanged. This is what a possible result looks like before we call it ready, and what your report could look like.
This is an in-house development by Sentinel Systematics, not client work. We built the system from scratch and test it in the same environment as a client product.
For client projects: we do not release third-party data and we never show one client the projects of another. This is covered by confidentiality, and we keep to it consistently. The names below are internal labels and cannot be traced by outsiders.
Basis: XAUUSD, tick test (model 4), Expert Advisor V3.14, 1 January 2015 to 30 October 2026, starting capital 100,000 USD. The test runs with an increased spread and without commission, which is the usual way. Test costs are about 11 points per lot (T250 11.2, W300 10.9). In addition we stress at 14 points per lot in total and beyond, up to 30 points. Unless stated otherwise.
The path of a system
01 · completed
Individual set files
Several configurations are built and tested one by one. Here the two lines T250 and W300.
02 · current stage
Portfolio merge
The best set files are merged at portfolio level. The report shows the target before all files are created.
03 · next step
Forward test on a test account
For a defined time, one to three months on average, the system runs on a test account.
04 · after that
First live account
Only after that does it go onto a first live account.
Account balance over time, start 100,000 USD
- T250 alone: 241,129 USD
- W300 alone: 305,294 USD
- T250 + W300 on one account: 736,152 USD
Each line is one account at 0.1 % risk per zone. The combined account is on top because it collects both returns. It also carries both risks.
The three accounts compared
| Account | Trades | End balance USD | Profit USD | Return % | max. DD % | Losing streak | End balance at real costs USD | MC DD q95 / q99 % |
|---|---|---|---|---|---|---|---|---|
| T250 alone | 9,790 | 241,129 | 141,129 | 141 | 3.7 | 32 | 254,393 | 5.3 / 6.5 |
| W300 alone | 15,109 | 305,294 | 205,294 | 205 | 5.7 | 38 | 334,782 | 6.9 / 8.3 |
| T250 + W300 on one account | 24,899 | 736,152 | 636,152 | 636 | 9.2 | 66 | 851,662 | 11.6 / 13.7 |
Return per year in % of the balance at the start of the year
| Account | 2015 | 2016 | 2017 | 2018 | 2019 | 2020 | 2021 | 2022 | 2023 | 2024 | 2025 | 2026 | Total |
|---|---|---|---|---|---|---|---|---|---|---|---|---|---|
| T250 alone | 5.2 | 10.6 | 5.5 | 4.6 | 9.6 | 0.0 | 3.7 | 5.2 | 4.1 | 8.2 | 14.6 | 21.6 | 141 |
| W300 alone | 5.0 | 10.4 | 8.8 | 4.4 | 12.6 | 2.6 | 2.9 | 6.7 | 2.8 | 11.6 | 18.9 | 34.0 | 205 |
| T250 + W300 on one account | 10.5 | 22.1 | 14.8 | 9.2 | 23.4 | 2.6 | 6.7 | 12.3 | 7.0 | 20.7 | 36.3 | 62.9 | 636 |
2026 is a part year up to 30 October.
How independent are the two set files?
The correlation of monthly returns is 0.926. T250 has a position open in 7.2 % of all hours, W300 in 10.1 %. Every hour in which T250 is open, W300 is open too. The mix therefore smooths little: the drawdown of the combined account is 9.2 % against 3.7 % and 5.7 % separately. This figure stands unvarnished in the report because it affects the decision on accounts.
Countless combinations, you decide
The portfolio overview shows two set files side by side and on one shared account, at 0.1 % risk each. This is an illustration, not a prescription. Anyone who wants to split their risk runs two accounts with one set file each, perhaps with different risk values. Others run both set files on one account, with the same or different risk parameters. There are countless combinations and risk levels. The operator decides in each case, that is we for our own systems or you for yours. The report makes the consequences visible before the decision is made.
Return per year and set file
Return per year in % of the balance at the start of the year
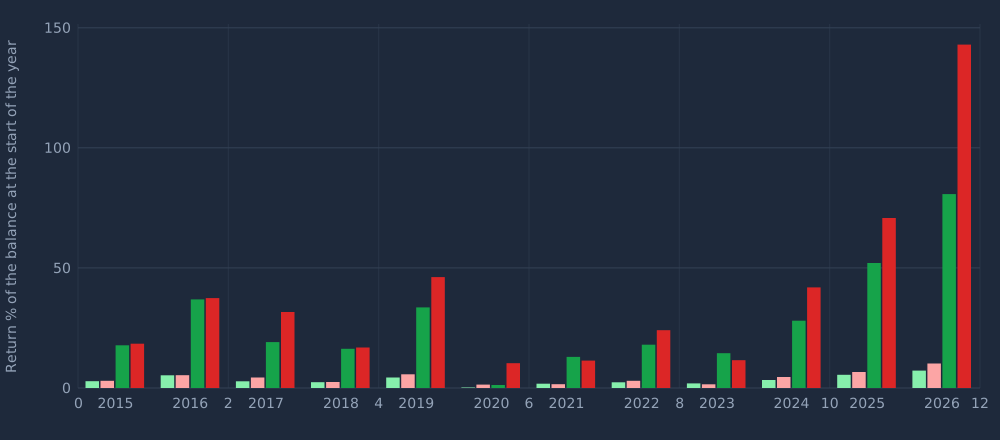
- T250 FIX
- W300 FIX
- T250 RISK
- W300 RISK
Robustness and costs
Costs are the bottleneck of every trading logic. So next to the test stands the question of what remains of the result when every trade gets more expensive. The curves run from 0 to 30 points of additional cost per lot.
Net in USD with rising additional costs (FIX 0.10 lot)
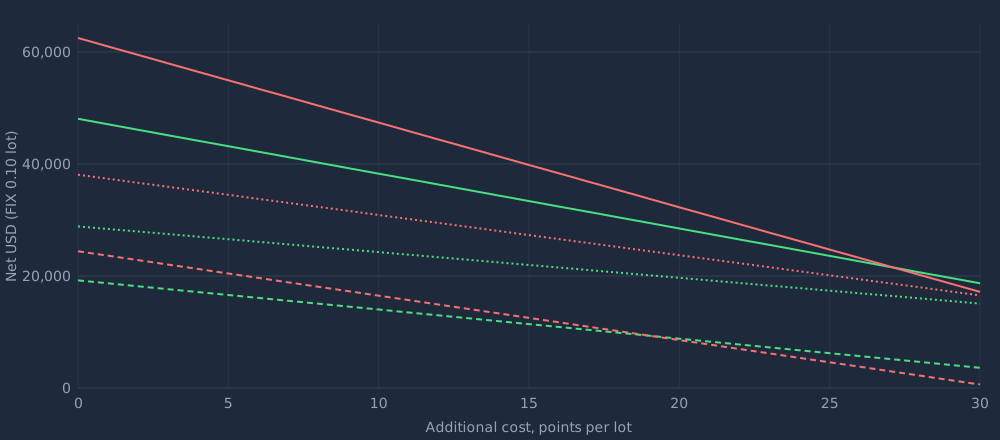
- T250
- W300
- Total
- Period 1
- Period 2
Share of the net that remains with additional costs, in %
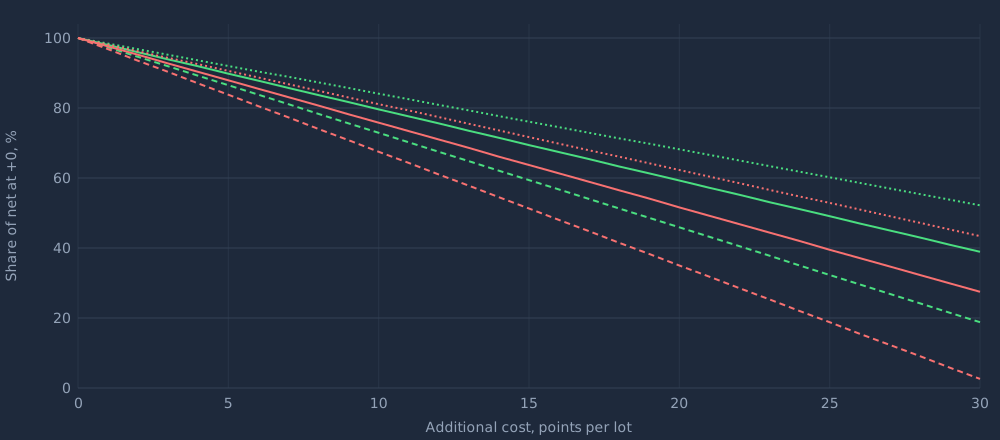
- T250
- W300
Real costs against the test
The test contains an increased spread; commission is 0. In addition we check at 14 points per lot in total (spread plus commission). The surcharge is the difference to 14.
| Set file | Test costs pts/lot | Surcharge to 14 | FIX 0.10 lot net test USD | FIX 0.10 lot net at 14 USD | RISK 0.3 % end balance test USD | RISK 0.3 % end balance at 14 USD | RISK DD test / 14 % |
|---|---|---|---|---|---|---|---|
| T250 | 11.2 | +2.8 | 48,056 | 45,271 | 1,622,249 | 1,381,533 | 10.4 / 10.7 % |
| W300 | 10.9 | +3.1 | 62,483 | 57,699 | 3,668,883 | 2,782,415 | 15.5 / 16.1 % |
Monte Carlo check
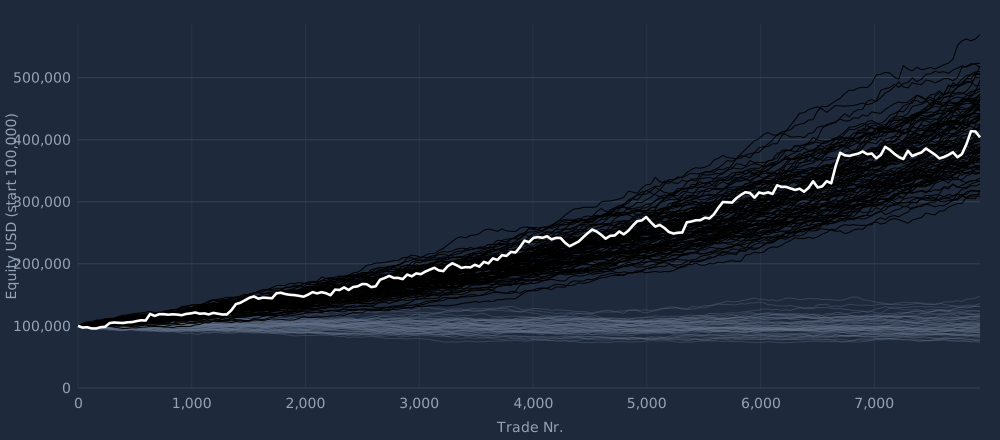
The same trades, reshuffled thousands of times. Shown are 100 of 10,000 paths for W300 at 0.3 % risk in period 1. White is the real path. Both images belong to the same row of the table below.
Order shuffled (monthly blocks)
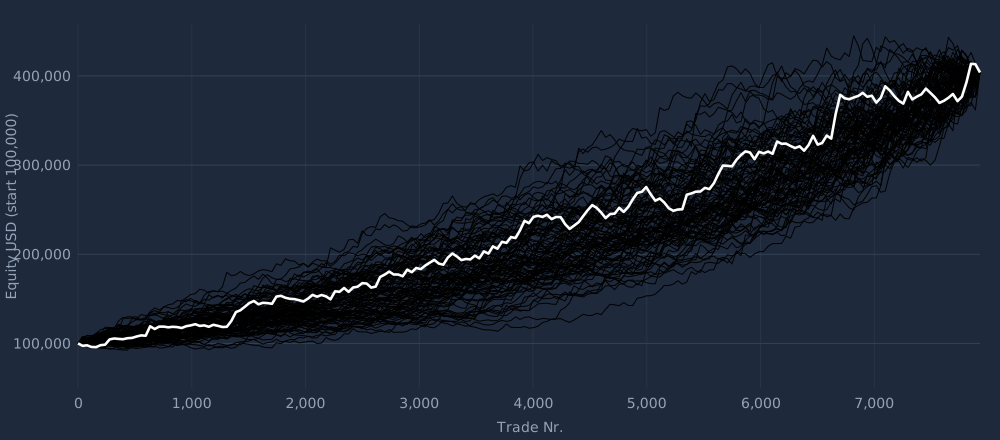
Bootstrap: trades with replacement, with null model
Monte Carlo check per set file and period
10,000 paths per method. DD q99 weeks: the worst drawdown not exceeded in 99 of 100 reorderings of calendar weeks. P(loss) and p_null: share of paths without profit, and of null paths without an edge, that reach the real result. +20 pts: result with an additional 20 points of cost per lot. FIX: always 0.10 lot, no compounding, values in USD. RISK: 0.3 % per zone with compounding, values in %.
| Run | Period | Trades | Result USD / % | Hit rate % | Payoff | DD real | DD q99 weeks | P(loss) % | p_null % | +20 pts |
|---|---|---|---|---|---|---|---|---|---|---|
| T250, FIX 0.10 lot | Total | 9,790 | 48,055.53 | 49.38 | 1.597 | 1,823.91 | 3,135.43 | 0.0 | 0.0 | 28,475.53 |
| T250, FIX 0.10 lot | Period 1, to 2020 | 5,197 | 19,203.07 | 50.22 | 1.423 | 1,737.78 | 3,234.23 | 0.0 | 0.0 | 8,809.07 |
| T250, FIX 0.10 lot | Period 2, from 2021 | 4,593 | 28,852.46 | 48.42 | 1.796 | 1,823.91 | 2,383.63 | 0.0 | 0.0 | 19,666.46 |
| W300, FIX 0.10 lot | Total | 15,109 | 62,482.94 | 48.69 | 1.545 | 2,804.74 | 3,928.77 | 0.0 | 0.0 | 32,264.94 |
| W300, FIX 0.10 lot | Period 1, to 2020 | 7,929 | 24,410.52 | 49.62 | 1.381 | 2,091.19 | 4,070.83 | 0.0 | 0.0 | 8,552.52 |
| W300, FIX 0.10 lot | Period 2, from 2021 | 7,180 | 38,072.42 | 47.66 | 1.729 | 2,804.74 | 3,052.26 | 0.0 | 0.0 | 23,712.42 |
| T250, RISK 0.3 % | Total | 9,790 | 1,522.25 % | 49.38 | 1.584 | 10.39 | 17.23 | 0.0 | 0.0 | 403.75 |
| T250, RISK 0.3 % | Period 1, to 2020 | 5,197 | 202.22 % | 50.22 | 1.410 | 9.94 | 17.73 | 0.0 | 0.0 | 62.57 |
| T250, RISK 0.3 % | Period 2, from 2021 | 4,593 | 436.78 % | 48.42 | 1.781 | 10.39 | 13.38 | 0.0 | 0.0 | 209.87 |
| W300, RISK 0.3 % | Total | 15,109 | 3,568.88 % | 48.69 | 1.531 | 15.54 | 21.31 | 0.0 | 0.0 | 503.04 |
| W300, RISK 0.3 % | Period 1, to 2020 | 7,929 | 303.90 % | 49.62 | 1.368 | 11.88 | 21.83 | 0.0 | 0.0 | 56.82 |
| W300, RISK 0.3 % | Period 2, from 2021 | 7,180 | 808.37 % | 47.66 | 1.714 | 15.54 | 16.93 | 0.0 | 0.0 | 284.54 |
Profit and loss per trade
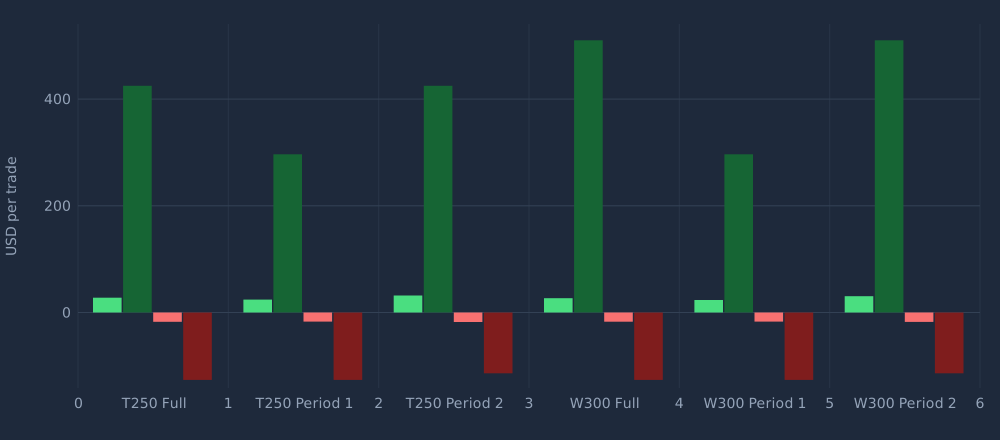
FIX 0.10 lot, USD per closed deal, start 100,000 USD, no compounding. With RISK the lot grows with the account, so there are no USD values per trade.
| Run | Period | Avg profit USD | Avg loss USD | Max profit USD | Max loss USD |
|---|---|---|---|---|---|
| T250, FIX | Total | 27.75 | -17.37 | 425.00 | -126.40 |
| T250, FIX | Period 1, to 2020 | 24.24 | -17.03 | 296.68 | -126.40 |
| T250, FIX | Period 2, from 2021 | 31.88 | -17.75 | 425.00 | -114.00 |
| W300, FIX | Total | 26.73 | -17.30 | 510.27 | -126.40 |
| W300, FIX | Period 1, to 2020 | 23.46 | -16.99 | 296.68 | -126.40 |
| W300, FIX | Period 2, from 2021 | 30.49 | -17.64 | 510.27 | -114.00 |
Profit and loss per trade (USD)
- Avg profit
- Max profit
- Avg loss
- Max loss
Turnover and cost threshold per line
| Line | Trades | Lots/month FIX | Lots/month RISK | FIX net USD | FIX at +14 pts USD | of which % | Break-even pts total / period 1 / period 2 |
|---|---|---|---|---|---|---|---|
| T250 | 9,790 | 6.89 | 148.94 | 48,056 | 34,350 | 71 | 49.1 / 37.0 / 62.8 |
| W300 | 15,109 | 10.64 | 335.01 | 62,483 | 41,330 | 66 | 41.4 / 30.8 / 53.0 |
We show you details like these 1:1, because trust comes from being able to recompute, not from promises.
Backtest results on historical data. They are not a promise of profit and no indication of future results.
Protecting your product
Your source code stays yours
Anyone who hands over a product does not want to lose control of it. We protect, encrypt and limit your source code and tie its use to the conditions you set.
Protection
Protect and encrypt source code
The product leaves your house only in protected form. Your logic, formulas and parameter values are not readable in plain text.
Limit
Expiry date
You decide until when the product may run. After the expiry date it removes itself from the chart and is unusable. Ideal for trial versions and time-limited licences.
Licence
Bound to a name
The product only becomes active if the account holder's name matches the name in the code. It runs only for the person it is meant for.
Licence
Bound to an account number
The product runs only on the account whose number is stored in the code. On any other account it stays inactive.
The measures can be chosen singly or combined, for example account number plus expiry date for a time-limited licence on one specific account.
No protection is absolute. Our measures raise the effort for unauthorised use and copying considerably, but they do not replace a contract with your customers.
News reader
A protection layer, not a signal source
A news reader that can do more than low, medium and high
An ordinary news reader knows three levels. It reads low, medium and high impact events and stops the EA before and after the event. Our solution goes further and can be set to your own rules.
- Select by currency. The reader monitors only events that affect your currencies, for example USD alone or USD;EUR;CAD together.
- Filter by keyword. You decide which events should stop the EA, for example nfp, non-farm, fomc, cpi, rate, speech, powell, claims, g7 or elections. This captures not only the levels low, medium and high but every custom event you list.
- Windows before and after the event. You set the minutes before and after the event separately, plus the impact level from which trading is blocked.
- Bank holidays. Included on request. On bank holidays market depth is thin, which can lead to unusual market moves (spikes).
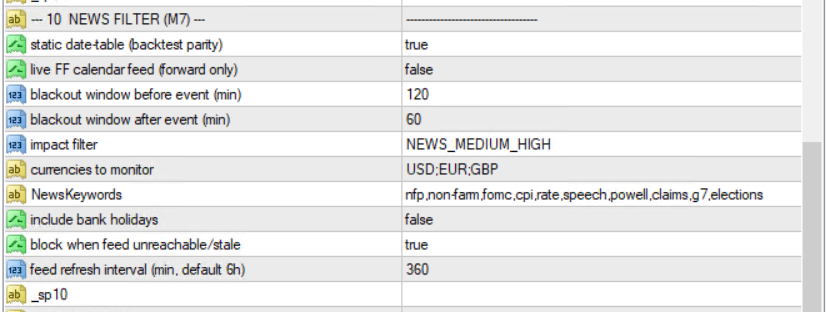
The static date table is identical in backtest and live operation. An additional live feed of the economic calendar is possible. If it fails or goes stale, the EA blocks as a precaution.
Speed
No tick churning: lean and fast
Tick churning describes a situation in which a trading algorithm performs an extreme number of calculations or data changes on every incoming price tick without any trading advantage resulting from it: a data or compute loop on every tick. The system is slowed down for technical reasons, in backtest as well as in normal operation.
- Find the repetitions. If certain processes in the code are repeated too often by mistake, cross and repeat sequences arise that obstruct and slow each other down.
- Make it lean and fast. We measure what really costs compute time per tick and optimise those processes until the EA runs economically.
- Behaviour stays the same. The optimisation does not change what the EA trades. We compare before and after to confirm that trades and equity stay identical.
Speed is sometimes decisive and makes the small difference that counts.
Latency
Measuring routing and order times
How long does what take? We measure the individual requests, the time until the broker reacts to your order, and the total order processing time.
- Measure and read out. Requests, broker response time and total processing time are recorded individually.
- Optimise latency. These values show how order routing can be accelerated.
- Judge your broker. The values show how good or bad your broker is.
- Why it matters. Worse routing and processing times mean your order reaches the order book behind other market participants. That means more slippage, worse prices and less profit. With market execution the best available price applies, not the desired one.
- Other order types. Most brokers work with market execution. Order types such as fill or kill, instant order or OCO (one cancels the other) are mostly offered only via FIX API.
Nothing is left to chance.
Monitoring
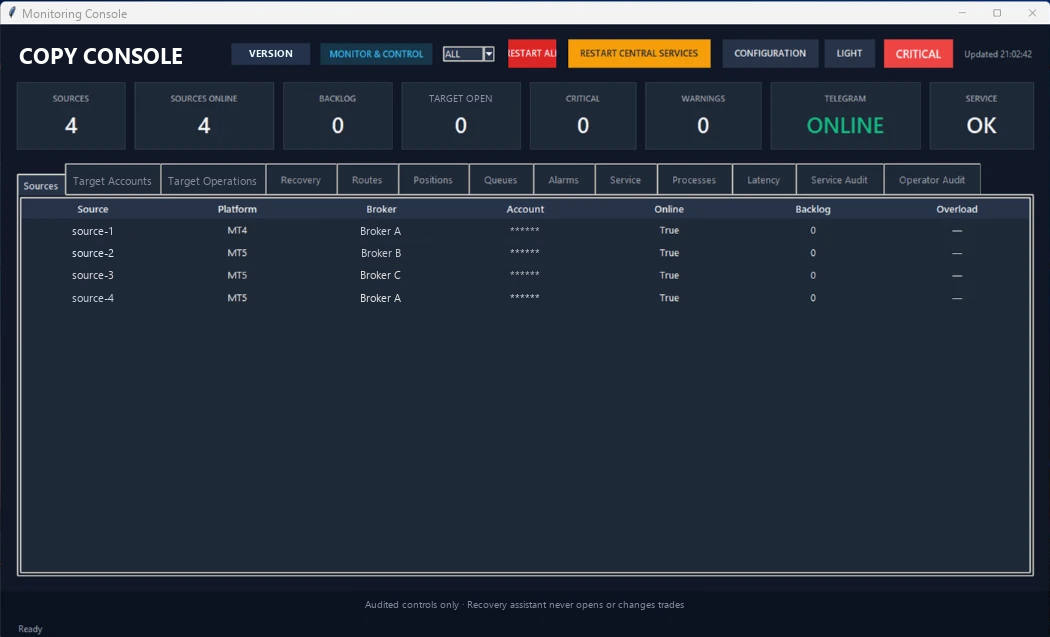
What monitoring looks like in operation
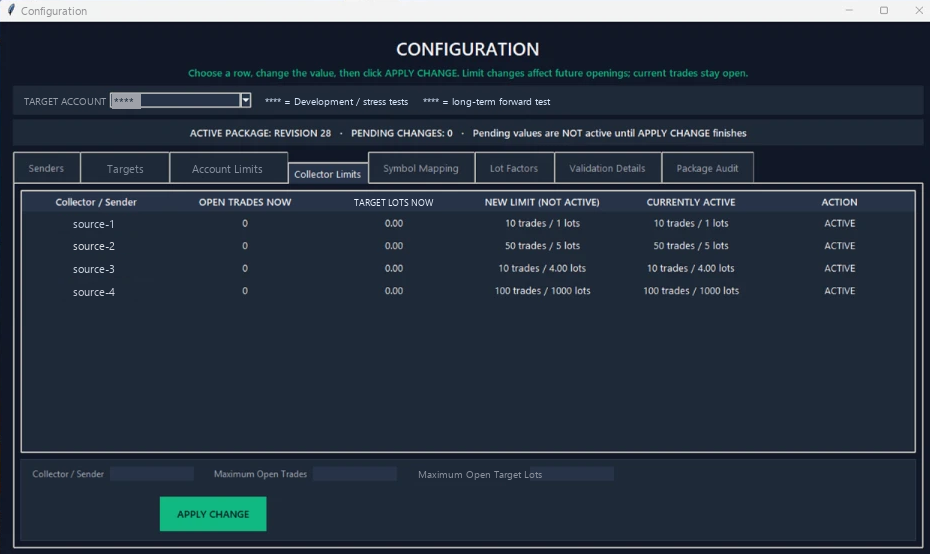
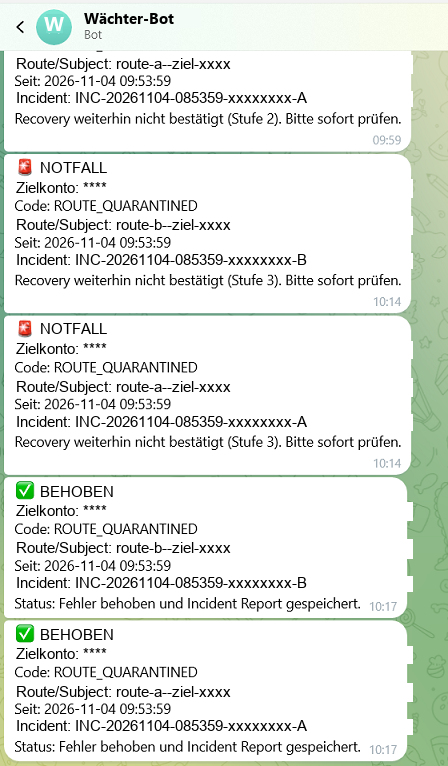
A watchdog panel shows sources, backlog, open target positions and service status. Critical states and confirmed all-clears are also sent as a message to Telegram or WhatsApp, so nobody has to watch the screen all the time.
Test process
Eight stages, from requirement to monitoring
Every function is tested in several stages, logged and tested again before it counts as production-ready.
- 01
Requirements and failure modes
Before any code, the expected behaviour, edge cases and forbidden states are described: duplicate orders, missing confirmations, stale events, wrong accounts, broker suffixes, closed sessions, a restart with open positions.
- 02
Versioned builds
Every released stage gets its own version with source files, executables, configuration, test results and hashes. Published versions are never silently overwritten.
- 03
Static checks and compilation
Syntax, dependencies, version markers, input parameters and safety-relevant code paths are checked before runtime tests. Compiler logs are kept, and errors and warnings are removed or explained.
- 04
Targeted functional tests
Each function is first tested in isolation: open, modify, partially close, fully close, lot calculation, signal latching, symbol resolution, state recovery. Expected and actual state are logged.
- 05
Integration and broker checks
Then the whole chain follows, with real symbol names, minimum and maximum lot, step size, tick size, trading session and API responses. Ambiguous symbol matches are not guessed but blocked.
- 06
Load, restart and fault injection
Trade bursts, fast state changes, connection drops, restarts, stale snapshots, temporary broker rejections and contradictory states. After every disturbance, positions and journal must match again.
- 07
Manual acceptance, complete and repeated
All settings are played through systematically over hours and checked in configuration, runtime behaviour and audit data. Then the entire sequence runs once more, not only the step that failed before.
- 08
Controlled go-live and monitoring
Before the start, identities, active configuration, open positions and queues are checked, and source and target are reconciled again afterwards. Status files, audit journal and alert channels show deviations continuously.
What “0 errors” means
A result with a clearly defined scope
“0 errors” is not a promise for every conceivable future situation. It means: within a test scope defined and documented in advance, all expected states were reached, no unexplained deviation remained open, and the repeat run gave the same result.
New broker conditions, platform changes or rare external faults can create new situations. That is why diagnosis, telemetry, safe isolation and restart belong to the product just as much as the trading logic.
This includes the last mile. If a single error appears after three hours of load testing, it is fixed and the test is repeated from the start, not just the affected part. Even when the overall result is green, we hold back the release as long as one assignment is not confirmed beyond doubt.
Reliability does not come from nothing unexpected ever happening, but from a system that detects deviations early and handles them in a controlled way.
Honest numbers
Development and verification stay separate
The figures we show come from real tests on tick data. Nothing is altered afterwards: the equity lab recalculates the recorded trades of one test report unchanged and matches the report at the default values.
Our principle: development and selection happen on a development period. The verification period stays untouched, because every look at it turns it into another development period.
This takes time. A system goes through the research model in Python, reconciliation with the Expert Advisor on tick data, robustness tests and Monte Carlo runs. For the example system in the equity lab, that was a good six weeks of round-the-clock testing.
Go to the equity lab →Evidence
Figures from a documented acceptance run
Example of an acceptance run, not a product promise
- 3 h
- bidirectional soak test
- 544
- checked opens from MT4 and MT5 runs
- 544
- matching closes
- 91
- checked partial closes
- 30
- trades created at once in the load peaks, up to
- 0
- open test positions after the final reconciliation
The figures describe one concrete test run with several FX symbols and gold. They are transparent evidence, not a blanket guarantee.
Frequently asked questions
Questions about EAs, MT4, MT5 and trade copiers
- What is the difference between MT4 and MT5?
- Both are trading platforms from MetaQuotes, but they use different programming languages (MQL4 and MQL5). An MT4 Expert Advisor therefore does not simply run on MT5, it has to be rebuilt. MT5 also offers different account models and order functions.
- Can I have an EA programmed if I only have an idea?
- Yes. Describe your trading and risk rules in the contact form. We clarify open points with you before any programming starts.
- Can I move my MT4 EA to MT5?
- Yes, by rebuilding the code. On request it can be extended at the same time, for example with new error handling.
- What is a trade copier?
- A program that transfers trades from one account to one or more others, on the same server or over the internet. We build trade copiers between MT4 and MT5 in both directions.
What happens next?
Two ways forward, depending on what you need
You have a project, or you first want to understand how we test.
Send an enquiry
Need an Expert Advisor, an MT4 to MT5 rebuild, a copy system, an integration, or testing and protection for your own product? Tell us about your project.
To the contact form →Read the methodology
The whole chain of checks from hypothesis to forward test, with every stage in detail.
To the methodology →